If you’ve ever joined three or four tables and watched your result set explode into duplicate rows — or collapse into nothing — you already know the problem. SQL joins aren’t hard because the syntax is complicated. They’re hard because getting them wrong is silent. Nothing errors out. You just get the wrong answer and don’t find out until someone downstream questions the numbers.
For most developers, that means constantly re-checking ER diagrams, double-checking column names, and re-deriving cardinality rules you’ve worked out before — just not anywhere you can find them again.
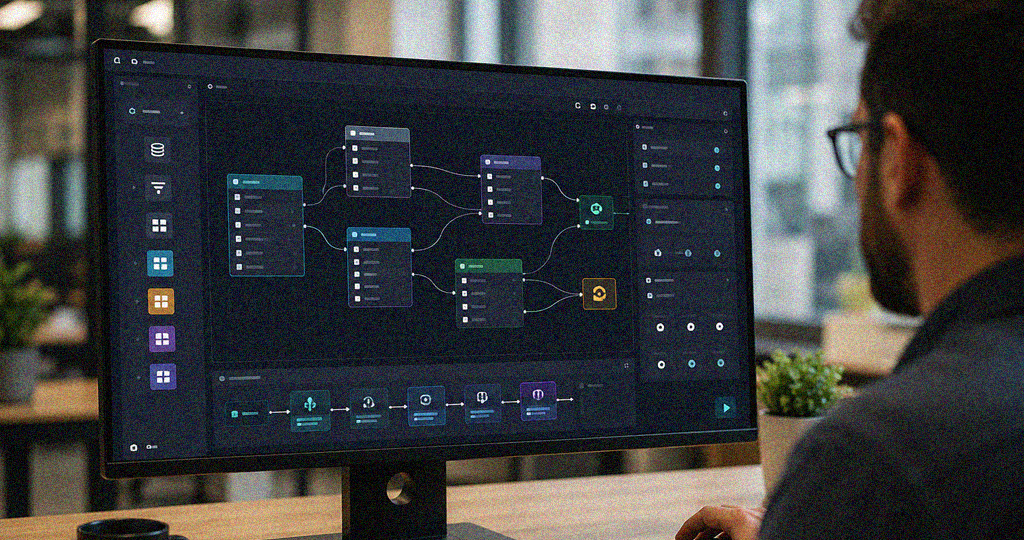
Meii’s Join Canvas exists to take that mental overhead and make it visible instead. Tables become nodes, relationships become lines you can trace with your eyes, and conditions become editable rules instead of buried WHERE clauses.
Why joins quietly cost more than they should
Joins sit at the center of almost every meaningful query, which also makes them the place where bugs hide and debugging time disappears. A few patterns show up in nearly every team:
Syntax overhead eats time before the query even runs — remembering exact table names, foreign keys, and which side of the join is which. Logic that should be written once ends up rewritten every time someone needs a similar cut of the data, because there’s nowhere it lives that anyone else can find. And when a query suddenly returns twice the expected rows, the debugging usually isn’t about the business logic at all — it’s about tracing which join condition silently fanned out. New developers feel this hardest: it can take weeks before they know which joins are safe to reuse and which ones quietly break something else.
This is the same bottleneck behind why writing SQL from scratch slows teams down — joins are just where it shows up first and most often.
What the Join Canvas actually changes
The shift is simple to describe: instead of parsing lines of code to figure out how two tables relate, you look at a canvas and see it. Meii’s Visual Query Builder automatically detects foreign key relationships and suggests joins as you drag tables onto the canvas, so the starting point is already close to correct rather than a blank editor.
What makes this different from just another drag-and-drop layer on top of SQL:
Nothing is hidden. Every visual action you take translates back into real, readable SQL you can inspect, validate, or edit directly — there’s no black box between what you clicked and what runs against your database.
Relationships don’t have to be rebuilt. Once a join is defined, it’s saved in the Model Builder, so the next person who needs customer-to-order-to-product logic doesn’t start from a blank canvas. They start from what’s already validated.
It respects the schema underneath. The canvas isn’t a sketch layered on top of your data — it understands keys, cardinality, and performance implications, so speed doesn’t come at the cost of accuracy. That trade-off is exactly what self-service reporting tools get wrong when they let anyone build a report without any guardrails underneath.
From one-off joins to shared models
A single join solves a single query. It doesn’t scale past that. This is why the Join Canvas feeds directly into the Model Builder — the canvas is where you define a relationship for the task in front of you, and the Model Builder is where that relationship becomes something the rest of the org can build on.
The practical difference shows up fast. Instead of five developers each writing a slightly different version of “customer joined to orders joined to products,” there’s one version, validated once, reused everywhere. Marketing’s dashboard and finance’s dashboard stop disagreeing about numbers that should be identical, because they’re pulling from the same defined relationship instead of five independent interpretations of it.
That consistency is really just data governance happening as a side effect of how the tool works, rather than a separate initiative someone has to run.
What actually changes day to day
A developer stops losing an afternoon to figuring out why the marketing dashboard and the finance dashboard don’t agree — the join logic is already defined once, not reconstructed five different ways.
A new hire doesn’t spend their first month reverse-engineering how customer, order, and product tables relate. They open the model and it’s already there.
Whoever used to sit between the business team and engineering, translating requests into SQL, stops needing to — the logic is already validated and accessible without a middleman.
It’s the same pattern that shows up anywhere context gets built into the system instead of living in someone’s head: people spend less time firefighting and more time on the work that actually needed a developer in the first place.
Isn’t this just SQL with extra steps?
Fair question. You could write every join by hand. The difference is what happens after you write it.
Code written once doesn’t naturally scale across a team — someone else has to find it, understand it, and trust it before they’ll reuse it. A visual model, by contrast, is self-explanatory in a way a text file never is; the relationships are the interface. And when logic only exists as copy-pasted code, errors multiply every time it’s copied. A model enforces one definition instead of a dozen near-identical ones.
Meii isn’t replacing SQL here. It’s making SQL something a team can actually see, share, and build on — instead of something that lives in whoever wrote it last.
The point of all this
No developer signed up to spend their career debugging why a left join returned three times the expected rows. The Join Canvas and Model Builder together remove that specific kind of repetitive mechanics, without taking away the transparency or control developers actually want.
For an individual developer, that means faster builds and fewer 2am “why don’t these numbers match” moments. For a team, it means one shared source of truth instead of five slightly different ones. For the business, it means the data strategy actually holds up at scale instead of quietly fragmenting the more people touch it.
Try building your first join visually and see what the Join Canvas catches before you’d have caught it yourself: explore the Visual Query Builder →